Water Data · Las Vegas Xeriscape Research
Las Vegas Water Usage Statistics: Consumption, Sources, Per-Capita Use and Conservation
- By
- Las Vegas Xeriscape
- Published
- Last verified
- Dataset version
- 1.0
Scope: Southern Nevada Water Authority service area unless a statistic is explicitly labeled LVVWD, Robert B. Griffith project-level, City of Las Vegas or State of Nevada.
Las Vegas Xeriscape Research is the research and reference section of Las Vegas Xeriscape. Las Vegas Xeriscape also operates a separate commercial consultation-request service for xeriscape projects; this page contains no lead form, provider promotion, affiliate link or call to action. The site is not affiliated with the Southern Nevada Water Authority, Las Vegas Valley Water District, U.S. Bureau of Reclamation or any government agency.
Las Vegas water usage statistics do not collapse into one interchangeable total. The Las Vegas Valley Water District reported 102.716 billion gallons of customer water consumption in fiscal 2025, excluding recharged-water sales—an average of 281.4 million gallons per day. In separate statewide federal accounting for calendar 2025, Nevada consumptively used 197,570 acre-feet of Colorado River water—64.38 billion gallons, or 176.4 million gallons per day—after qualifying return flows.
Both numbers are accurate. They answer different questions. LVVWD's figure covers a provider service area, a fiscal year, customer categories and more than one source of supply; the federal figure covers statewide Colorado River accounting for a calendar year after qualifying returns. The rest of this report keeps those boundaries visible.
Las Vegas water usage statistics at a glance
| Statistic | Latest verified value | What it measures |
|---|---|---|
| LVVWD customer-category consumption | 102.716 billion gallons in FY2025 | LVVWD service area; customer-category consumption excluding recharged-water sales |
| LVVWD daily equivalent | 281.4 million gallons per day | FY2025 annual total divided by 365 |
| Nevada Colorado River consumptive use | 197,570 acre-feet / 64.38 billion gallons in 2025 | Statewide federal accounting after qualifying returns |
| Nevada return flows | 245,955 acre-feet in 2025 | Measured and unmeasured returns in statewide federal accounting |
| Robert B. Griffith Water Project diversion | 434,422 acre-feet in 2025 | Gross Lake Mead diversion on a separately reported project line |
| Estimated Las Vegas Wash return flow | 242,838 acre-feet in 2025 | Separate Nevada accounting line; USBR labels the value estimated |
| SNWA regional per-capita use | 95 GPCD in 2024 | Regional consumptive gallons per capita per day |
| Typical annual source mix | Nearly 90% Colorado River; about 10% groundwater | Las Vegas Valley municipal supply |
| Residential share of metered use | 58.6% in 2024 | Southern Nevada regional municipal metered use |
| Per-capita change | Down 58% from 2002 through 2025 | Current SNWA agency-reported rounded change |
Sources: LVVWD Annual Comprehensive Financial Report, Enterprise Fund (Unaudited), Table 3; U.S. Bureau of Reclamation 2025 Colorado River Accounting and Water Use Report, Tables 6 and 11; SNWA 2026 Water Resource Plan, Chapter 3; SNWA FY2025–26 Budget; SNWA conservation reporting. Gallon, daily-average and combined-share values are calculations by Las Vegas Xeriscape Research. Verified July 22, 2026.
Scope rule: On this page, “Las Vegas” means the SNWA Southern Nevada service area unless a statistic is explicitly labeled LVVWD, Robert B. Griffith project-level, City of Las Vegas or State of Nevada. “Fiscal 2025” and “calendar 2025” are different periods.
Las Vegas water usage data: four findings from the ledger
The ledger produces four concise findings that are easy to state without flattening unlike measurements into one total. Each comparison below either uses one same-scope dataset or places separately reported figures side by side with their boundaries intact.
| Finding | Verified result | Why the comparison matters |
|---|---|---|
| More active accounts, slightly less provider consumption | LVVWD had 14.5% more active accounts in FY2025 than in FY2016 while reporting 1.2% less customer-category consumption | Provider growth and total consumption did not move in lockstep over the decade |
| More than half of Nevada's gross diversion returned | Nevada's 2025 measured and unmeasured return flows equaled 55.5% of gross Colorado River diversions, leaving 44.5% as consumptive use | Gross diversion is not the amount permanently consumed |
| Residential share is similar in two separately reported datasets | Residential categories represented 58.74% of LVVWD FY2025 consumption and 58.6% of Southern Nevada municipal metered use in 2024 | Both systems identify residential use as the largest category, despite different periods and boundaries |
| Per-capita use fell while population grew | SNWA reports that per-capita water use fell 58% from 2002 through 2025 while regional population grew by approximately 876,000 residents | The region's long-run efficiency trend cannot be read from population growth alone |
Sources: LVVWD Annual Comprehensive Financial Report, unaudited statistical Table 3; USBR 2025 Colorado River Accounting and Water Use Report, Table 6; SNWA 2026 Water Resource Plan, Chapter 3, Figure 3.3; SNWA conservation reporting.
How much water did Las Vegas use in 2025?
Two annual measurements answer two common versions of the question. LVVWD reported 102.716 billion gallons across its customer categories in fiscal 2025, excluding recharged-water sales; Nevada's separate federal ledger reported 197,570 acre-feet of net Colorado River consumptive use in calendar 2025.
The two most useful annual totals
| Measurement | Period | Geography | Annual value | Daily equivalent | Status |
|---|---|---|---|---|---|
| LVVWD customer-category consumption excluding recharged-water sales | Fiscal year ended June 30, 2025 | LVVWD service area | 102.716 billion gallons | 281.4 MGD | Reported gallons; daily average derived |
| Nevada Colorado River consumptive use | Calendar year 2025 | State of Nevada | 197,570 acre-feet / 64.38 billion gallons | 176.4 MGD | Reported acre-feet; converted values derived |
Sources: LVVWD Annual Comprehensive Financial Report, Enterprise Fund (Unaudited), Table 3 and USBR 2025 Colorado River Accounting and Water Use Report. LVVWD's fiscal year ended June 30, 2025. USBR's accounting covers January 1 through December 31, 2025.
Do not subtract these two totals. LVVWD's figure covers a provider boundary, a fiscal-year period, customer-category consumption excluding recharged-water sales and more than one source of supply; USBR's figure is statewide calendar-year Colorado River consumptive use after qualifying returns.
The 2025 Colorado River water-use ledger
| Metric | Acre-feet | Gallons | Average MGD | Scope | Status |
|---|---|---|---|---|---|
| Robert B. Griffith Water Project diversion | 434,422 | 141.56 billion | 387.83 | SNWA Lake Mead wholesale project line | Reported AF; converted values derived |
| Estimated Las Vegas Wash return flow | 242,838 | 79.13 billion | 216.79 | Separate Nevada accounting line | Reported estimate; converted values derived |
| RBG diversion minus Las Vegas Wash return — cross-line comparison | 191,584 | 62.43 billion | 171.04 | Cross-line comparison; not an official project or statewide consumptive-use measure | Derived |
| Total Nevada diversions | 443,525 | 144.52 billion | 395.95 | Statewide Colorado River accounting | Reported AF; converted values derived |
| Measured returns | 244,412 | 79.64 billion | 218.20 | State of Nevada | Reported AF; converted values derived |
| Unmeasured returns | 1,543 | 502.79 million | 1.38 | State of Nevada | Reported AF; converted values derived |
| Total Nevada returns | 245,955 | 80.14 billion | 219.57 | State of Nevada | Derived sum |
| Nevada consumptive use | 197,570 | 64.38 billion | 176.38 | State of Nevada | Official reported AF; converted values derived |
Source: U.S. Bureau of Reclamation, Colorado River Accounting and Water Use Report: Arizona, California, and Nevada, Calendar Year 2025, Table 6. USBR labels the Las Vegas Wash return-flow value as an estimate. Acre-foot inputs are reported; gallon, MGD, share and cross-line values were calculated by Las Vegas Xeriscape Research. View the primary report.
Data: CSV · Data dictionary · Methodology
Nevada's measured and unmeasured returns equaled 55.5% of its gross Colorado River diversions in 2025. Official consumptive use equaled the remaining 44.5%. That is why “water withdrawn” is not synonymous with “water used up.”
The RBG-minus-Wash cross-line comparison result was 191,584 acre-feet, while official statewide consumptive use was 197,570 acre-feet. The difference was 5,986 acre-feet, or approximately 1.95 billion gallons, because the two calculations include different components.
What do these Las Vegas water usage statistics show—and what do they not show?
The data shows that Southern Nevada returns a large share of diverted Colorado River water, that residential customers account for most municipal metered deliveries and that per-capita use has fallen sharply since 2002. It does not support blending provider deliveries, project withdrawals, statewide net use and GPCD into one “Las Vegas total.”
Which number answers which question?
| Question | Best figure to use | Dataset | Do not misstate it as |
|---|---|---|---|
| How much water did LVVWD report across its customer categories? | 102.716 billion gallons in FY2025 | LVVWD unaudited statistical Table 3 | City of Las Vegas-only use or net Colorado River consumption |
| How much Colorado River water did Nevada consumptively use? | 197,570 acre-feet in calendar 2025 | USBR statewide accounting | A provider delivery total |
| How much did the Robert B. Griffith project divert from Lake Mead? | 434,422 acre-feet in calendar 2025 | USBR project line | Water permanently consumed |
| What estimated return flow did USBR report for the Las Vegas Wash? | 242,838 acre-feet in calendar 2025 | USBR separate Nevada accounting line | A complete project or statewide return total |
| How efficiently did the region use water per resident? | 95 GPCD in 2024 | SNWA consumptive-use method | Average household indoor use |
| Who received municipal metered water? | 2024 sector shares | SNWA regional sector chart | Sector shares of net Colorado River depletion |
Original reconciliation of the official LVVWD, USBR and SNWA measurement systems.
Compact definitions
| Term | Plain-language definition | Why it matters here |
|---|---|---|
| Diversion | Water taken from a river, reservoir or project before return-flow credits | A gross diversion is not the amount permanently consumed |
| Return flow | Qualifying water returned to the Colorado River system after use and treatment | Return flows reduce net consumptive use under federal accounting |
| Consumptive use | Diversion minus qualifying return flow | This is the basis of Nevada's Colorado River apportionment accounting |
| Metered use | Water recorded at customer meters | Useful for customer-sector shares, but not automatically equal to net Colorado River use |
| GPCD | Consumptive gallons per capita per day under SNWA's regional formula | A regional efficiency metric, not the amount on an average household bill |
| Direct reuse | Treated wastewater reused for irrigation or another approved purpose without first returning to Lake Mead | One route through which treated wastewater is recycled |
| Indirect reuse | Treated wastewater returned through the Las Vegas Wash to Lake Mead, producing return-flow credits | Explains how gross withdrawals can exceed net consumptive use |
| Acre-foot | 325,851 gallons, enough to cover one acre one foot deep | The standard unit used in federal Colorado River accounting |
| Nonfunctional turf | Grass used primarily for appearance rather than active recreation, subject to the applicable definitions and exceptions | The category addressed by the January 1, 2027 irrigation prohibition |
Sources: USBR acre-foot conversion; SNWA 2026 Water Resource Plan, Chapter 3; SNWA laws and ordinances.
How were these Las Vegas water usage statistics assembled?
We assembled the Las Vegas Water-Use Ledger from primary USBR, SNWA and LVVWD publications and rechecked the source set on July 22, 2026. Every consequential value is labeled by period, geography, accounting scope and whether it was reported directly, reported as an estimate or bound, normalized from the source unit, or calculated from reported inputs.
We did not estimate missing years from chart pixels, turn rounded percentages into false precision or treat differently scoped datasets as interchangeable. Where current official pages publish different counters, both source-specific values appear in the discrepancy register and downloadable release.
Source hierarchy
- Federal accounting: U.S. Bureau of Reclamation annual Colorado River accounting.
- Regional planning and conservation: SNWA water-resource plans, conservation plans, budgets and current program pages.
- Provider consumption: LVVWD annual financial reporting and customer guidance.
- Derived figures: Unit conversions, sums, shares, indices and comparisons calculated from published inputs.
Calculation rules
- Gallons:
acre-feet × 325,851 - Average MGD:
annual gallons ÷ 365 ÷ 1,000,000 - Return share:
total return flow ÷ total diversion × 100 - Consumptive share:
consumptive use ÷ total diversion × 100 - Cross-line comparison:
Robert B. Griffith diversion − estimated Las Vegas Wash return flow - Customer-category share:
category gallons ÷ LVVWD total gallons × 100 - Percentage change:
(later value ÷ earlier value − 1) × 100 - Index:
year value ÷ FY2016 value × 100
Reproducibility checks
| Check | Arithmetic | Result | Treatment |
|---|---|---|---|
| Statewide federal balance | 443,525 AF diversions − 245,955 AF total returns | 197,570 AF | Matches USBR's reported consumptive-use total |
| Cross-line comparison | 434,422 AF RBG diversion − 242,838 AF estimated Wash return | 191,584 AF | Not official project or statewide consumptive use |
| LVVWD category check | Sum of 15 FY2025 customer categories | 102,716,130 thousand gallons | Matches LVVWD's reported total |
| Regional sector check | Sum of eight displayed 2024 shares | 99.9% | Expected source-rounding difference |
| 2025 GPCD check | SNWA budget performance measure | Less than 95 GPCD | No exact final value inferred |
Sources: USBR 2025 accounting report; LVVWD Annual Comprehensive Financial Report, unaudited statistical Table 3; SNWA FY2025–26 Budget.
What is original in this release?
The government measurements are not ours. The original work is the selection, transcription, normalization, scope reconciliation, reported-versus-derived labeling, calculation, discrepancy tracking and versioned assembly of data that otherwise sits across several incompatible official publications. Dataset version 1.0 contains 314 normalized records.
How to cite this page
The following reference identifies the publisher, page title, dataset version, update date and stable URL. Underlying measurements remain attributed to the agencies identified beneath each table; calculations and the cross-source assembly are identified as derived.
Las Vegas Xeriscape. “Las Vegas Water Usage Statistics: Consumption, Sources, Per-Capita Use and Conservation.” Las Vegas Xeriscape Research, dataset version 1.0. Published and last verified July 22, 2026. https://lasvegasxeriscape.com/research/las-vegas-water-usage-statistics/When did Nevada's Colorado River consumptive use peak in 2025?
Nevada's monthly Colorado River consumptive use peaked in August at 27,029 acre-feet and was lowest in December at 6,783 acre-feet. August consumptive use was almost four times December's value, but the federal table alone does not assign that difference to a single cause.
Nevada monthly Colorado River accounting, 2025
| Month | Nevada diversion, AF | Total returns, AF | Return share | Consumptive use, AF | Consumptive share |
|---|---|---|---|---|---|
| January | 30,447 | 20,680 | 67.9% | 9,767 | 32.1% |
| February | 27,501 | 19,167 | 69.7% | 8,334 | 30.3% |
| March | 34,671 | 21,616 | 62.3% | 13,055 | 37.7% |
| April | 38,239 | 20,186 | 52.8% | 18,053 | 47.2% |
| May | 40,635 | 21,071 | 51.9% | 19,564 | 48.1% |
| June | 43,032 | 19,404 | 45.1% | 23,628 | 54.9% |
| July | 46,797 | 19,837 | 42.4% | 26,960 | 57.6% |
| August | 46,496 | 19,467 | 41.9% | 27,029 | 58.1% |
| September | 38,758 | 20,257 | 52.3% | 18,501 | 47.7% |
| October | 36,380 | 20,776 | 57.1% | 15,604 | 42.9% |
| November | 31,743 | 21,451 | 67.6% | 10,292 | 32.4% |
| December | 28,826 | 22,043 | 76.5% | 6,783 | 23.5% |
| 2025 total | 443,525 | 245,955 | 55.5% | 197,570 | 44.5% |
Source: U.S. Bureau of Reclamation, 2025 accounting report, Table 6. Total returns and monthly shares were calculated from the reported measured-return, unmeasured-return, diversion and consumptive-use rows. View the primary report.
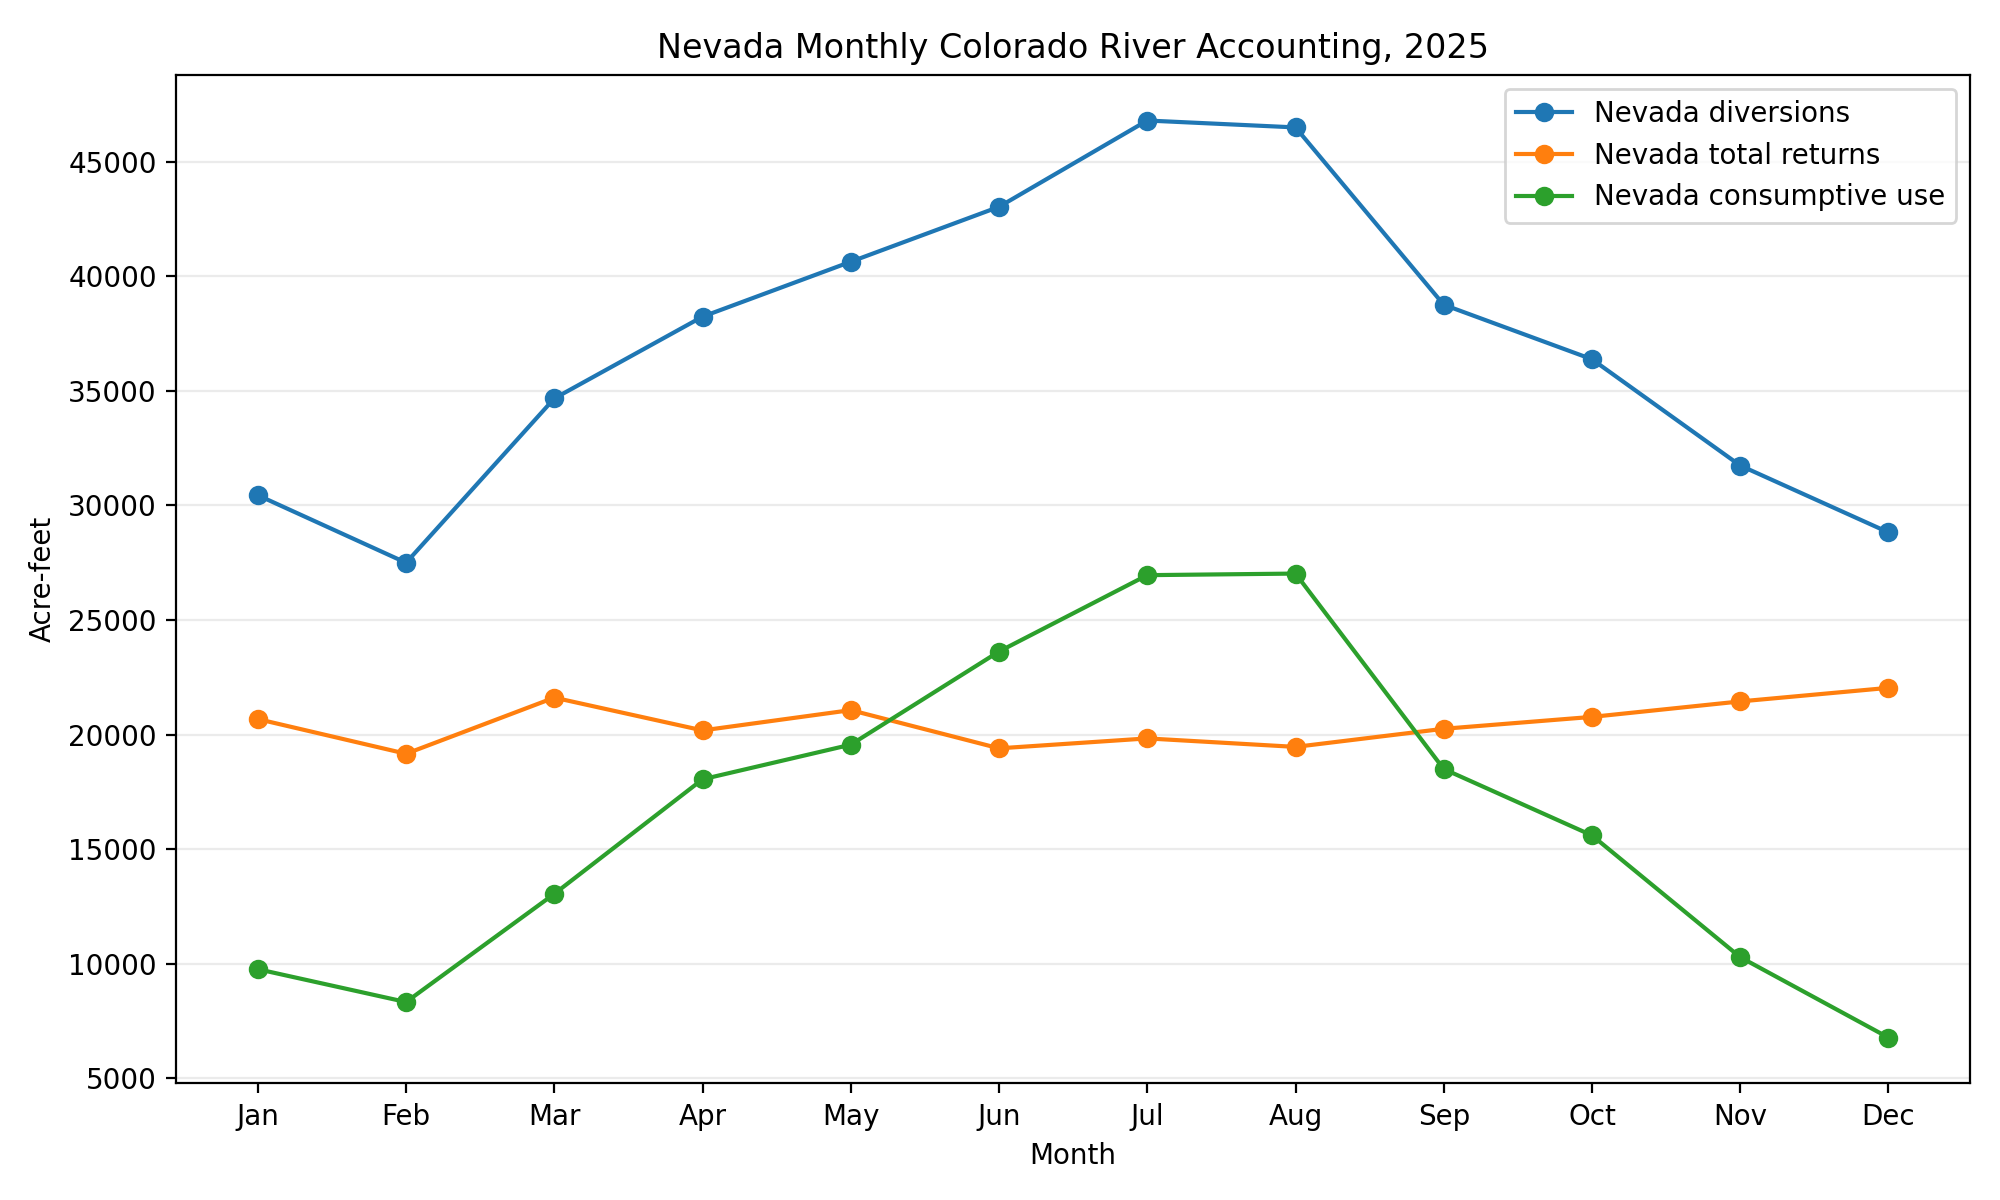
The monthly series is statewide Nevada accounting. It is not a City of Las Vegas, household-only or SNWA-only demand series.
Las Vegas water usage by year: LVVWD consumption and active accounts, 2016–2025
LVVWD's fiscal 2025 customer-category consumption was 1.2% lower than fiscal 2016, even though year-end active accounts increased 14.5%, from 380,791 to 436,077. Fiscal 2025 consumption rose 3.7% from fiscal 2024, so the long-term comparison did not develop in a straight line.
LVVWD consumption and active accounts, fiscal 2016–2025
| Fiscal year | Consumption, billion gallons | Active accounts at June 30 | Consumption index, FY2016=100 | Account index, FY2016=100 |
|---|---|---|---|---|
| 2016 | 103.956 | 380,791 | 100.0 | 100.0 |
| 2017 | 108.208 | 387,829 | 104.1 | 101.8 |
| 2018 | 108.911 | 392,700 | 104.8 | 103.1 |
| 2019 | 105.673 | 397,336 | 101.7 | 104.3 |
| 2020 | 104.302 | 402,911 | 100.3 | 105.8 |
| 2021 | 109.302 | 408,542 | 105.1 | 107.3 |
| 2022 | 107.043 | 412,800 | 103.0 | 108.4 |
| 2023 | 101.738 | 419,352 | 97.9 | 110.1 |
| 2024 | 99.014 | 428,243 | 95.2 | 112.5 |
| 2025 | 102.716 | 436,077 | 98.8 | 114.5 |
Source: Las Vegas Valley Water District, Annual Comprehensive Financial Report for the Fiscal Years Ended June 30, 2025 and 2024, Enterprise Fund (Unaudited), Table 3, “Water Consumption, Revenue, and Active Accounts.” The source reports consumption in thousands of gallons and excludes recharged-water sales; billion-gallon and index values above are derived. View the primary report.
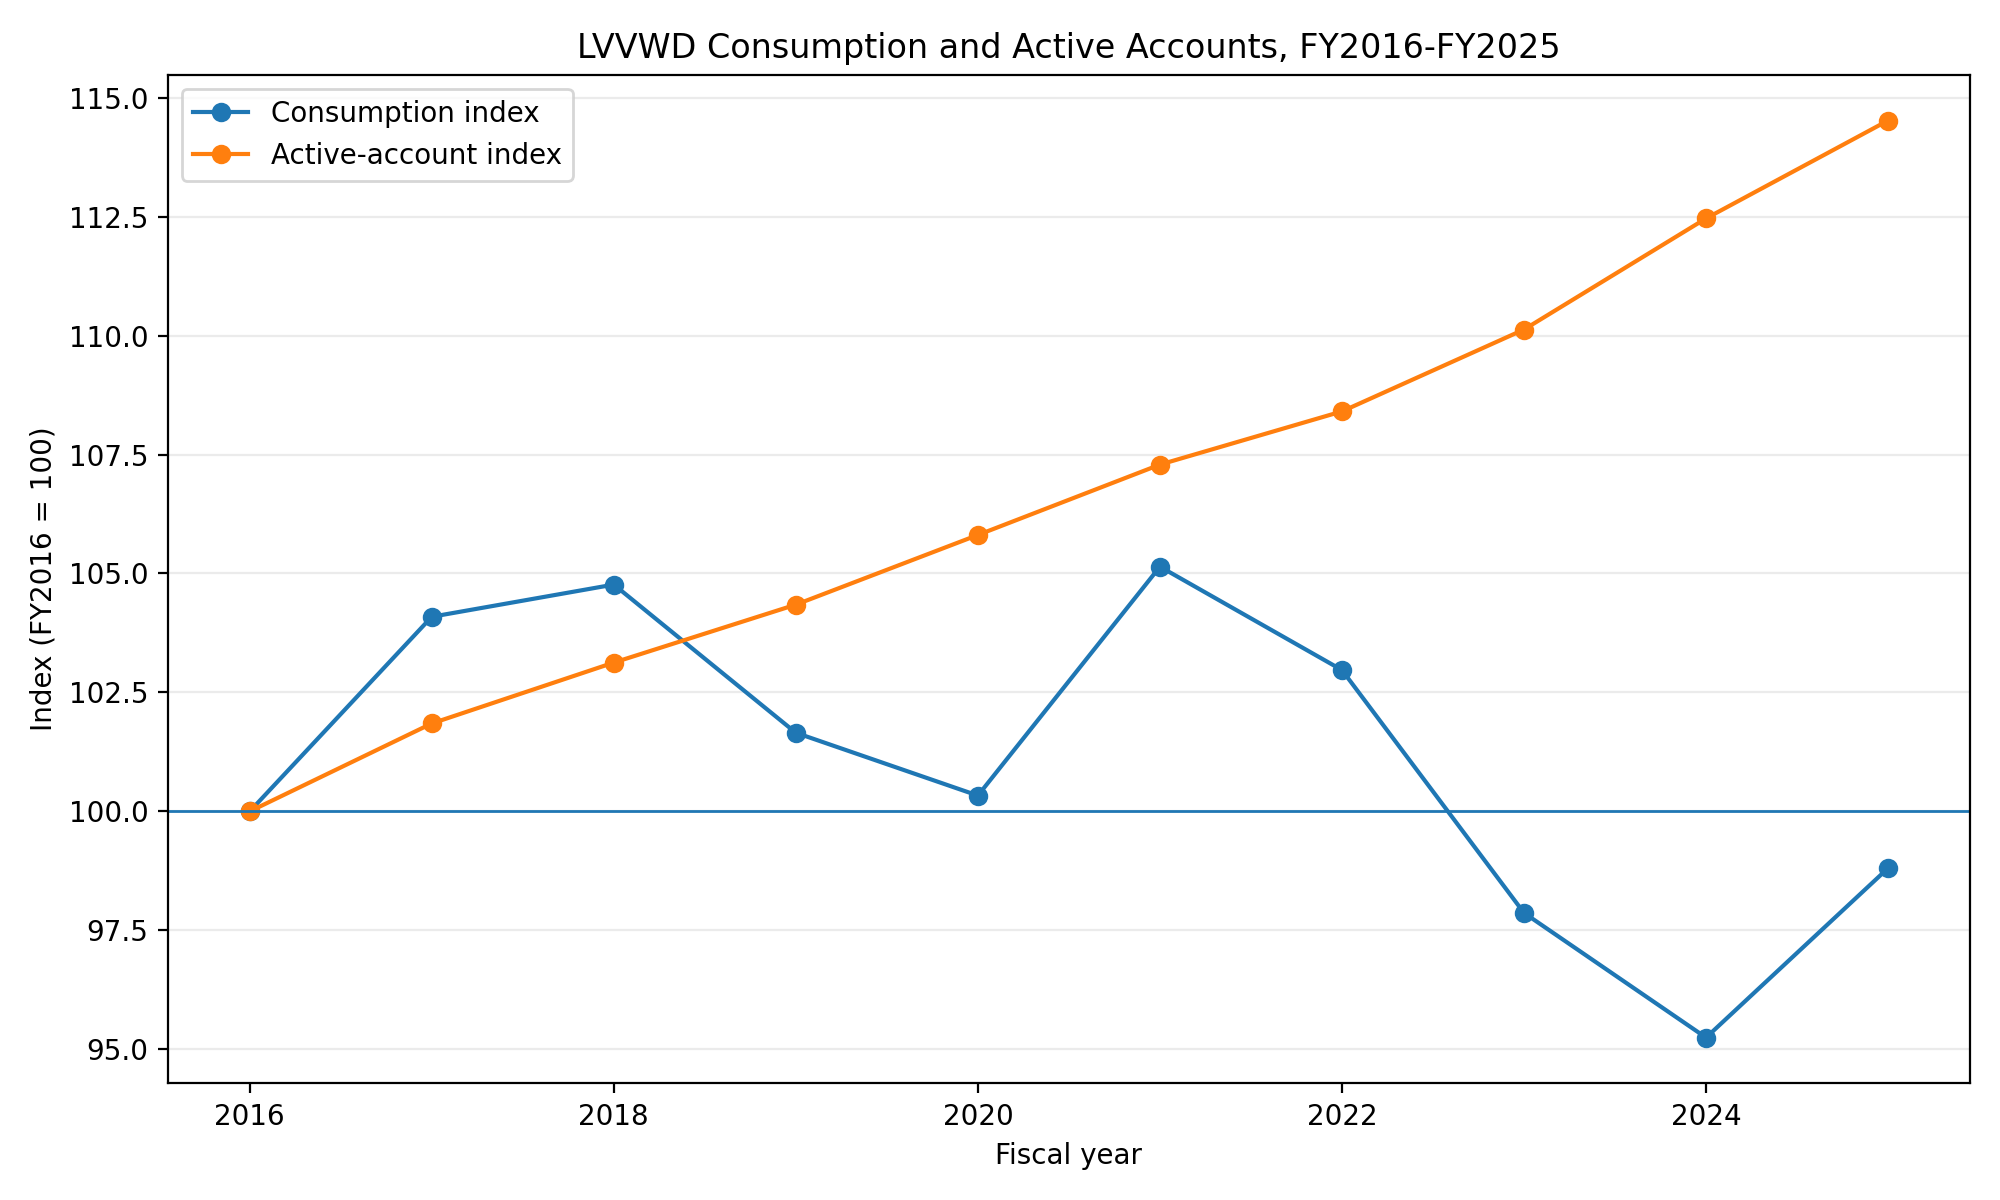
The data supports a careful conclusion: the provider served more active accounts in fiscal 2025 than in fiscal 2016 while reporting slightly less customer-category consumption. It does not prove that one conservation program, price change, weather pattern or development rule caused the difference.
LVVWD also identifies historical account reclassifications affecting several customer categories. That caveat matters when comparing category-specific values through time.
Who uses the most water in Las Vegas?
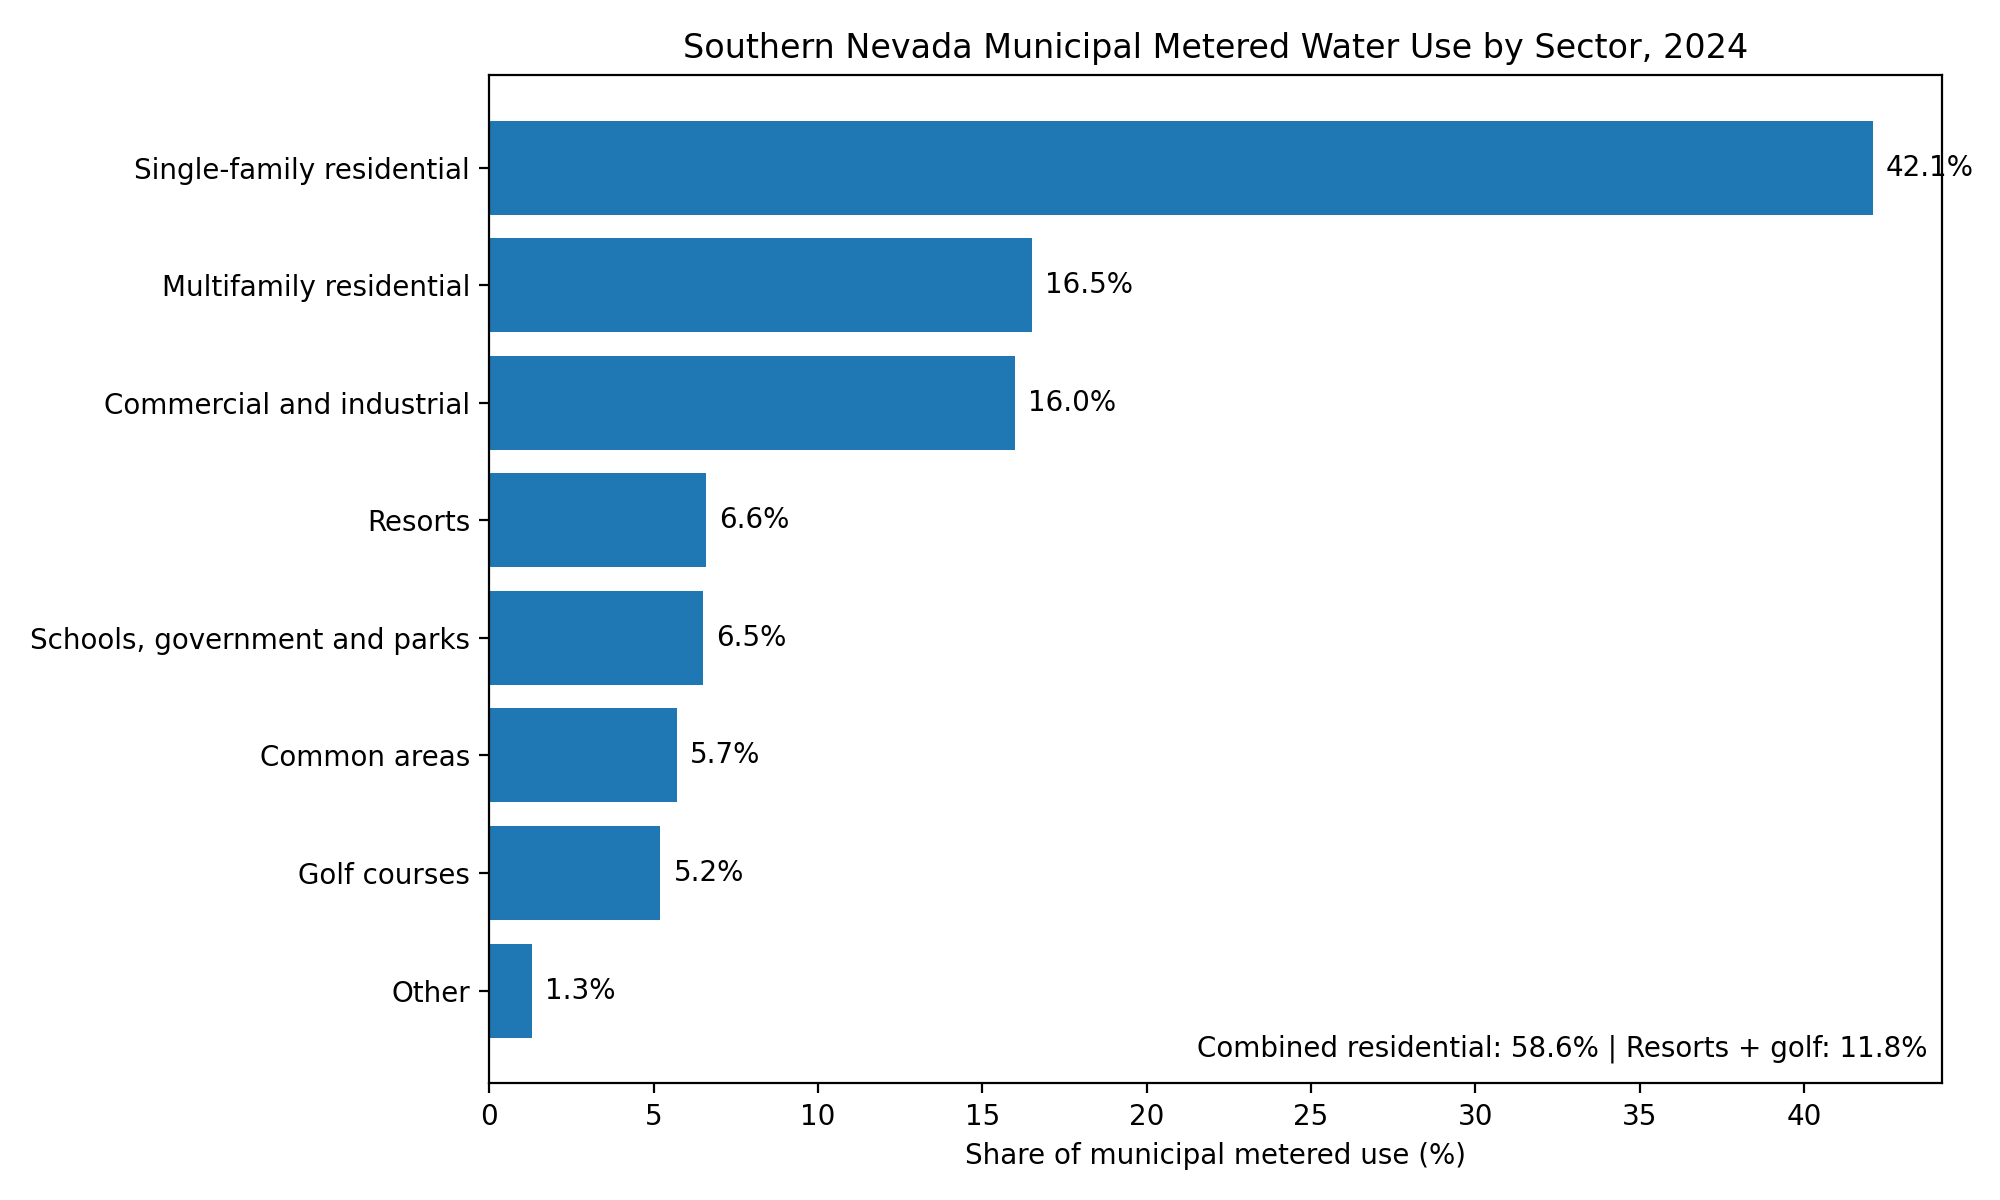
Residential users are the largest category in both current datasets reviewed. Single-family and multifamily sectors represented 58.6% of Southern Nevada municipal metered use in 2024, while LVVWD's four residential categories represented 58.74% of fiscal 2025 customer-category consumption.
Southern Nevada municipal metered use by sector, 2024
| Sector | Share of municipal metered use |
|---|---|
| Single-family residential | 42.1% |
| Multifamily residential | 16.5% |
| Commercial and industrial | 16.0% |
| Resorts | 6.6% |
| Schools, government and parks | 6.5% |
| Common areas | 5.7% |
| Golf courses | 5.2% |
| Other | 1.3% |
| Combined residential | 58.6% |
| Resorts plus golf | 11.8% |
Source: Southern Nevada Water Authority, 2026 Water Resource Plan, Chapter 3, Figure 3.3. The eight official displayed categories total 99.9% because of rounding; the combined rows are calculations. These are metered delivery shares, not sector shares of net Colorado River consumptive use. View the primary source.
LVVWD fiscal 2025 consumption by customer category
| LVVWD customer category | Billion gallons | Share of FY2025 total |
|---|---|---|
| Residential—single service | 41.350 | 40.26% |
| Residential—duplex, triplex and fourplex | 0.602 | 0.59% |
| Apartments, condominiums and townhouses | 17.231 | 16.78% |
| Residential—other | 1.154 | 1.12% |
| Residential subtotal | 60.337 | 58.74% |
| Hotels | 9.169 | 8.93% |
| Motels | 1.108 | 1.08% |
| Hotels and motels subtotal | 10.276 | 10.00% |
| Community facilities | 2.123 | 2.07% |
| Schools | 1.582 | 1.54% |
| Fireline | 0.848 | 0.83% |
| Irrigation | 14.561 | 14.18% |
| Commercial and business | 9.103 | 8.86% |
| Recreational | 0.215 | 0.21% |
| Industrial | 1.373 | 1.34% |
| Construction water | 1.464 | 1.43% |
| Other | 0.834 | 0.81% |
| Total, excluding displayed subtotals | 102.716 | 100.00% |
Source: LVVWD Annual Comprehensive Financial Report, Enterprise Fund (Unaudited), Table 3. The table excludes recharged-water sales. Residential and hotel/motel subtotals and all percentage shares were calculated from the reported customer-category values. View the primary report.
Do casinos and resorts use most of the water?
No official dataset reviewed here supports that claim. Resorts represented 6.6% of Southern Nevada municipal metered use in 2024, while combined residential sectors represented 58.6%. In LVVWD's separately reported fiscal 2025 table, hotels and motels represented 10.0% of customer-category consumption.
Those figures have different denominators. “Resorts” in the regional chart and “hotels and motels” in the provider table should not be substituted for one another, and neither is a casino-only share of statewide consumptive use.
Do golf courses use most of the water?
No. Golf represented 5.2% of Southern Nevada municipal metered use in 2024. That is a meaningful sector, but it remains far below the combined residential share and does not represent golf's share of statewide Colorado River depletion.
Where does Las Vegas get its water?
The Las Vegas Valley typically receives nearly 90% of its annual municipal supply from the Colorado River through Lake Mead and about 10% from local groundwater. During June through September, groundwater can supply as much as 25% of daily demand, so a peak-day mix can look different from the annual average.
Sources, entitlements, reductions and stored supplies
| Measure | Latest verified value | Meaning |
|---|---|---|
| Typical Colorado River share | Nearly 90% | Approximate annual municipal-supply mix |
| Typical groundwater share | About 10% | Approximate annual municipal-supply mix |
| Summer groundwater contribution | Up to 25% of daily supply | Peak daily share during June–September, not annual average |
| Nevada basic Colorado River apportionment | 300,000 acre-feet per year | Basic consumptive-use apportionment before applicable accounting adjustments |
| SNWA estimated entitlement | 276,205 acre-feet per year | Planning figure that includes member-agency use and delivery to Nellis Air Force Base |
| Current combined Tier 1 shortage and DCP reduction | 21,000 acre-feet / 6.84 billion gallons | 13,000-acre-foot shortage reduction plus 8,000-acre-foot DCP contribution |
| Nevada total available Colorado River water in USBR's 2025 Table 11 | 197,570 acre-feet | Available amount after the table's shortage, conservation and other accounting entries |
| End-of-year cumulative injected Colorado River storage in the local aquifer | 353,864 acre-feet | 342,021 attributed to LVVWD and 11,843 to the City of North Las Vegas |
| Broader banked-supply portfolio through 2024 | More than 2.2 million acre-feet | SNWA banking, storage and recharge portfolio; not the same as local injected storage |
Sources: SNWA water sources; LVVWD water sources; SNWA 2026 Water Resource Plan, Chapter 3; SNWA shortage reporting; USBR 2025 accounting report, Tables 6 and 11.
A Tier 1 shortage remained in effect through 2026 and, together with Nevada's 8,000-acre-foot DCP obligation, reduced Nevada's available Colorado River supply by 21,000 acre-feet.
The local-storage figure needs its own boundary. USBR reported 353,864 acre-feet of end-of-year cumulative injected Colorado River storage in the local aquifer in 2025: 342,021 acre-feet attributed to LVVWD and 11,843 acre-feet to the City of North Las Vegas. That is local injected storage, not the broader SNWA portfolio total of more than 2.2 million acre-feet.
How much water does Las Vegas use per person?
SNWA reported 95 consumptive gallons per capita per day in 2024. Its FY2025–26 budget lists a CY2025 performance measure of less than 95 GPCD, but the reviewed sources do not provide a precise final 2025 value.
GPCD is a regional consumptive-use metric. SNWA calculates it from water sources diverted, less eligible Colorado River return-flow credits, divided by resident population and days; it is not an estimate of what one resident personally uses indoors.
SNWA consumptive GPCD, 2000–2025 reporting
| Year | GPCD | Year | GPCD |
|---|---|---|---|
| 2000 | 211 | 2013 | 117 |
| 2001 | 204 | 2014 | 116 |
| 2002 | 211 | 2015 | 111 |
| 2003 | 172 | 2016 | 113 |
| 2004 | 159 | 2017 | 114 |
| 2005 | 152 | 2018 | 113 |
| 2006 | 144 | 2019 | 101 |
| 2007 | 145 | 2020 | 112 |
| 2008 | 137 | 2021 | 110 |
| 2009 | 129 | 2022 | 104 |
| 2010 | 120 | 2023 | 89 |
| 2011 | 118 | 2024 | 95 |
| 2012 | 125 | CY2025 | Less than 95 (performance measure; exact final value not provided) |
| 2035 goal: 86 GPCD | SNWA stated efficiency target | ||
Sources: SNWA, 2024–2029 Joint Water Conservation Plan, Figure 1.1, for 2000–2023; SNWA FY2025–26 Budget for the 2024 result and CY2025 performance measure; SNWA 2026 Water Resource Plan, Chapter 3 for the 86-GPCD goal.
What does the 2035 goal require?
The gap between the 2024 result and the 2035 goal is 9 GPCD, a further reduction of approximately 9.5% from 95. SNWA also states that climate change and system age could increase local demand by 10 GPCD or more by 2035.
That comparison matters: the agency's stated upward pressure is larger than the entire nine-GPCD gap between the 2024 result and the goal. Reaching 86 GPCD therefore requires more than holding current use flat.
Can Las Vegas GPCD be compared directly with another city?
Not without checking the definitions. Climate, visitor demand, service-area boundaries, population estimates, imported water, wastewater accounting and return-flow credits can all change the numerator or denominator. A city comparison is only valid when both communities use compatible methods.
How much Las Vegas water is recycled?
SNWA's 2026 planning framework estimates that approximately 45% of delivered water becomes highly treated wastewater and that approximately 99% of that wastewater is recycled through direct reuse or return to Lake Mead. The remaining approximately 55% is consumed, mainly through landscape irrigation, cooling and evaporation.
The federal 2025 ledger uses a different geography and accounting system, but it offers a useful same-scope water balance: Nevada returns equaled 55.5% of gross Colorado River diversions, while consumptive use equaled 44.5%.
Planning estimates and observed federal accounting
| Measurement | Returned or recycled share | Consumed share | Scope | What it does not mean |
|---|---|---|---|---|
| SNWA delivered-water planning framework | About 45% becomes wastewater; about 99% of that wastewater is recycled | About 55% consumed | SNWA service area planning estimate | Not 99% of every gallon delivered |
| Nevada 2025 federal Colorado River accounting | 55.5% returned | 44.5% consumptively used | Statewide Colorado River accounting | Not a direct measurement of SNWA indoor use |
Sources: SNWA 2026 Water Resource Plan, Chapter 3 and USBR 2025 Colorado River Accounting and Water Use Report, Table 6. The two rows use different scopes and should not be treated as measurements of the same denominator.
“Southern Nevada recycles approximately 99% of its treated wastewater” is supported by the planning document. “Las Vegas recycles 99% of all water it uses” is not.
How much has Las Vegas reduced water use?
SNWA reports that Southern Nevada's per-capita water use fell 58% from 2002 through 2025 while population grew by approximately 876,000 residents, or 58%. Its current conservation summary also reports a 40% decline in Nevada Colorado River consumptive use for customers over that period.
Using the 2002–2024 period in SNWA's detailed 2026 plan, regional Colorado River consumptive use fell by approximately 116,000 acre-feet per year—about 37.8 billion gallons—while the region added approximately 829,000 residents.
Verified conservation outcomes
| Measure | Reported outcome | Period or qualifier |
|---|---|---|
| Per-capita water-use change | 58% decrease | 2002–2025, current SNWA summary |
| Population change | 58% increase / approximately 876,000 residents added | 2002–2025, current SNWA summary |
| Customer Colorado River consumptive-use change | 40% decrease | 2002–2025, current SNWA summary |
| Annual Colorado River consumptive-use reduction | Approximately 116,000 acre-feet / 37.8 billion gallons | 2002–2024 plan comparison |
| Population added in detailed plan comparison | Approximately 829,000 residents | 2002–2024 |
| Annual demand reduction attributed to incentive programs | Approximately 16.2 billion gallons per year | Current 2026 planning estimate |
Sources: SNWA conservation reporting; SNWA 2026 Water Resource Plan, Chapter 2; SNWA 2026 Water Resource Plan, Chapter 3. Gallon conversion of 116,000 acre-feet is derived.
Current conservation-program counters
| Program or measure | Source-specific result | Required interpretation |
|---|---|---|
| Water Smart Landscapes grass removed | More than 250 million square feet | Current program counter |
| Water Smart Landscapes cumulative savings | 203 billion gallons since 1999 on SNWA's conservation page | Source-specific counter |
| Water Smart Landscapes cumulative savings | 217 billion gallons since 1999 on Flowing Forward | Source-specific counter |
| Water Efficient Technologies cumulative savings | More than 24 billion gallons since 2001 on SNWA's conservation page | Source-specific counter |
| Water Efficient Technologies projects and savings | More than 480 projects; nearly 29 billion gallons on Flowing Forward | Source-specific counter |
| Nonfunctional grass removed | More than 24 million square feet | Current program counter |
| Nonfunctional-grass savings | Approximately 1.3 billion gallons per year | SNWA explicitly states an annual basis |
| Golf-course turf removed | More than 44 million square feet | Current program counter |
| Golf-course turf-conversion savings | Approximately 2.4 billion gallons saved | SNWA does not state whether this total is annual or cumulative |
Sources: SNWA What We're Doing to Conserve and SNWA Flowing Forward. The table preserves the wording and scope of each current source instead of silently combining different counters.
The defensible summary is that Water Smart Landscapes has saved more than 200 billion gallons since 1999. An exact single total is not published consistently across the current agency pages.
How much water can converting grass to desert landscaping save?
SNWA's Xeriscape Conversion Study measured 73.0 gallons per square foot per year applied to monitored turf and 17.2 gallons per square foot per year applied to monitored xeric landscaping. The difference was 55.8 gallons per square foot per year; current SNWA guidance commonly rounds the planning estimate to about 55 gallons.
| Converted area | Study-based difference at 55.8 gal/sq. ft./year | Rounded planning estimate at 55 gal/sq. ft./year |
|---|---|---|
| 500 square feet | 27,900 gallons per year | 27,500 gallons per year |
| 1,000 square feet | 55,800 gallons per year | 55,000 gallons per year |
| 5,000 square feet | 279,000 gallons per year | 275,000 gallons per year |
Sources: SNWA Xeriscape Conversion Study and SNWA laws and conservation guidance. The examples are arithmetic illustrations, not property-specific guarantees; actual savings vary with prior irrigation, plant mix, weather, design and maintenance.
For current rebate rules and conversion requirements, use the official SNWA Water Smart Landscapes source cited in this report.
Official-source discrepancy register
| Topic | Current official figures found | Publication treatment |
|---|---|---|
| Water Smart Landscapes cumulative savings | 203 billion gallons since 1999 on SNWA's conservation page; 217 billion gallons on Flowing Forward | Use “more than 200 billion gallons” unless quoting a source-specific counter |
| Water Efficient Technologies cumulative savings | More than 24 billion gallons since 2001 on SNWA's conservation page; nearly 29 billion gallons on Flowing Forward | Keep both source-specific figures and qualifiers; do not merge them until SNWA dates or reconciles the counters |
| CY2025 GPCD | FY2025–26 budget lists a performance measure of less than 95 GPCD; the current conservation page reports a 58% decline from 2002 through 2025 | Do not infer a precise final 2025 GPCD |
| 2024 sector shares | Some narrative summaries round residential, resorts and golf to approximately 60%, 7% and 5%; the plan figure reports 58.6%, 6.6% and 5.2% | Use the plan figure when precision matters |
| Recycling framework | One current explanation rounds indoor use to about 40%; the 2026 plan estimates that 45% becomes highly treated wastewater | Use one internally consistent framework and label it approximate |
Sources: SNWA conservation page; SNWA Flowing Forward; SNWA FY2025–26 Budget; SNWA 2026 Water Resource Plan, Chapter 3. Verified July 22, 2026.
How much water does a typical Las Vegas household use?
LVVWD states that a typical three- or four-person household uses approximately 4,000 to 5,000 gallons per month indoors. Total household use can be much higher when outdoor irrigation, pools, leaks or large landscapes are included.
The distribution is highly concentrated. LVVWD reports that the highest-using 10% of residential households—about 35,000 homes—account for more than 13 billion gallons annually, nearly one-third of residential demand.
| Household statistic | Value | Boundary |
|---|---|---|
| Typical three- or four-person household indoor use | 4,000–5,000 gallons per month | Indoor use only |
| Highest-using residential group | Top 10% | Agency-defined group |
| Approximate number of high-use homes | About 35,000 | Current LVVWD description |
| Annual demand from that group | More than 13 billion gallons | Annual total |
| Share of residential demand | Nearly one-third | Rounded agency description |
Source: Las Vegas Valley Water District, Excessive Use Charge FAQs. The indoor-use range should not be presented as total household use.
Is Las Vegas running out of water?
No single verified “years of water left” number answers that question. Southern Nevada has return-flow credits, groundwater, stored supplies, conservation programs and low-lake infrastructure, while the Colorado River remains under long-term hydrologic and allocation pressure.
A Tier 1 shortage is in effect in 2026. That current operating condition is material, but it is not a countdown clock. Future availability depends on basin hydrology, federal operating rules, state and interstate agreements, infrastructure, storage access, demand and conservation performance.
The evidence supports neither “Las Vegas will imminently run out” nor “Las Vegas cannot run out.” Both claims compress several changing systems into a certainty the published data does not establish.
Why do these water statistics matter now?
Several current decisions can change the figures and rules in this report. The most important are the post-2026 Colorado River operating process, the ongoing Tier 1 shortage, the 2035 conservation goal and the January 1, 2027 nonfunctional-turf irrigation prohibition.
| Current issue | Verified fact | Why it matters |
|---|---|---|
| Tier 1 shortage and DCP | Nevada's combined reduction is 21,000 acre-feet: 13,000 for shortage plus 8,000 for DCP | Changes the state's current Colorado River accounting position |
| Post-2026 operations | Reclamation released the Draft EIS on January 9, 2026; comments closed March 2 after 18,127 submissions | Future operating rules can change shortage and allocation mechanics |
| 2035 GPCD goal | 86 GPCD, nine below the 2024 result of 95 | Requires further regional efficiency gains |
| Climate and infrastructure pressure | SNWA states that climate change and system age could increase local demand by 10 GPCD or more by 2035 | The stated upward pressure exceeds the current nine-GPCD goal gap |
| Nonfunctional turf law | A January 1, 2027 prohibition applies to using Colorado River water to irrigate nonfunctional turf on properties not zoned exclusively for single-family residences, subject to the applicable functional-turf definitions and waiver process | Changes which landscapes can receive Colorado River water |
Sources: SNWA water shortages; USBR post-2026 operations; SNWA 2026 Water Resource Plan, Chapter 3; SNWA laws and ordinances. Verified July 22, 2026.
What are the limitations of this dataset?
No single public statistic represents every meaning of “Las Vegas water use.” The dataset combines several official systems but keeps their boundaries separate; the limitations below explain where a correct number can still become misleading.
- “Las Vegas” is shorthand. Unless otherwise noted, the page means the SNWA Southern Nevada service area, not only the incorporated City of Las Vegas.
- The two headline totals are not subtractable. LVVWD fiscal-year customer-category consumption and statewide calendar-year net Colorado River use are not components of one water balance.
- The 2025 federal consumptive-use figure is statewide. It includes the full set of Nevada Colorado River accounting components, not only one SNWA project line.
- The Las Vegas Wash line is estimated. USBR uses an agency-adopted historical-use method for the published value.
- The RBG-minus-Wash result is a cross-line comparison. It is not an official project or statewide consumptive-use measure and excludes components included elsewhere in federal accounting.
- Sector shares are metered-use shares. They do not directly measure each sector's net Colorado River consumptive effect.
- The 90%/10% source mix is approximate. Daily summer groundwater use can be substantially higher than the annual share.
- Recycling figures use rounded planning frameworks. The 45% wastewater estimate and the 99% wastewater-recycling estimate are not measurements of 99% of all delivered water.
- No precise final CY2025 GPCD was located. The reviewed budget publishes a performance measure of less than 95 GPCD.
- Annual use is weather-sensitive. A one-year increase or decrease should not automatically be attributed to policy, growth or behavior without direct evidence.
- Some customer accounts were reclassified. LVVWD identifies historical reclassifications affecting several categories.
- Program counters change and sometimes disagree. Current Water Smart Landscapes and Water Efficient Technologies totals differ across agency pages, so the release preserves each source-specific figure.
- The golf-course savings counter lacks a stated time basis. SNWA reports approximately 2.4 billion gallons but does not say whether that number is annual or cumulative.
- The dataset does not estimate unreported property-level use. It does not manufacture casino-only, neighborhood, individual golf-course or individual-household totals.
- Stored supplies are not a simple countdown. Availability depends on agreements, operating rules, withdrawal limits, system conditions and conservation performance.
- Current legal and shortage records can change. The current-status sections require re-verification after a federal declaration, operating-rule change, agency update or relevant legal revision.
What can be downloaded with this report?
Dataset version 1.0 contains 314 normalized records and matches the evidence shown in this article. It includes annual and monthly 2025 federal accounting, LVVWD fiscal 2016–2025 consumption and active accounts, all 15 LVVWD fiscal 2025 customer categories, the full 2000–2024 GPCD series, the CY2025 bound, 2024 sector shares, source mix, recycling, stored-water figures, household use, conservation measures, formulas, source locations and discrepancy notes.
- Las Vegas Water Usage Statistics Dataset — CSV
- Las Vegas Water Usage Statistics Dataset — XLSX
- Las Vegas Water Usage Statistics Data Dictionary — CSV
- Dataset version history — Markdown
The data dictionary includes the record ID, dataset group, period, geography, service area, reporting entity, metric, category, normalized value, original source value and unit, accounting role, reported-or-derived status, calculation, source title and location, publication date, URL, verification date and scope note.
Version history
| Version | Date | Change |
|---|---|---|
| 1.0 | Initial source reconciliation and synchronized CSV/XLSX release |
Source: Dataset version-history file. Version 1.0 has no recorded corrections.
Frequently asked questions about Las Vegas water use
These answers use the same periods, scopes and accounting definitions as the full tables above. Each answer identifies the measurement needed to keep a correct number from being used in the wrong context.
- How much water does Las Vegas use per day?
- LVVWD's fiscal 2025 customer-category total, excluding recharged-water sales, equals approximately 281.4 million gallons per day. Nevada's separate calendar 2025 net Colorado River consumptive-use total equals approximately 176.4 million gallons per day after qualifying returns.
- What percentage of Las Vegas water comes from Lake Mead?
- Nearly 90% of the Las Vegas Valley's typical annual municipal supply comes from the Colorado River through Lake Mead, while about 10% comes from local groundwater. Groundwater can provide as much as 25% of daily demand during June through September.
- How much water does Las Vegas use per person?
- SNWA reported 95 consumptive gallons per capita per day in 2024. Its FY2025–26 budget lists a CY2025 performance measure of less than 95 GPCD, but the reviewed sources do not provide a precise final 2025 value.
- Do Las Vegas casinos use most of the water?
- No official dataset reviewed here supports that claim. Resorts represented 6.6% of Southern Nevada municipal metered use in 2024, compared with 58.6% for combined residential sectors; LVVWD's separately scoped fiscal 2025 table assigns 10.0% to hotels and motels.
- How much water do Las Vegas golf courses use?
- Golf courses represented 5.2% of Southern Nevada municipal metered use in 2024. That is a delivery share, not golf's share of statewide net Colorado River consumptive use.
- Does Las Vegas recycle all of its water?
- No. SNWA estimates that about 45% of delivered water becomes highly treated wastewater and that approximately 99% of that wastewater is recycled directly or indirectly. Water consumed by irrigation, cooling and evaporation generally cannot be recovered.
- Why can Nevada withdraw more than 300,000 acre-feet from the Colorado River?
- Nevada's 300,000-acre-foot apportionment is measured in consumptive use, not gross withdrawals. Qualifying treated water returned to the Colorado River produces return-flow credits, so gross diversions can exceed 300,000 acre-feet while net consumptive use remains below the basic apportionment.
- How much water can turf conversion save in Las Vegas?
- SNWA's Xeriscape Conversion Study found a 55.8-gallon-per-square-foot annual difference between monitored turf and xeric landscaping. Current planning guidance commonly rounds that result to about 55 gallons per square foot per year; actual property savings vary.
- Is Las Vegas running out of water?
- No verified countdown answers that question. Southern Nevada has conservation programs, return-flow credits, groundwater, stored supplies and low-lake infrastructure, but it remains dependent on a stressed Colorado River system and is operating under a Tier 1 shortage framework in 2026.
- What is an acre-foot of water?
- One acre-foot equals 325,851 gallons—the volume needed to cover one acre one foot deep. This report uses that federal conversion for every gallon equivalent derived from acre-foot values.
Which primary sources support this report?
The report relies on issuing agencies and original data producers. Secondary articles, forums and promotional pages were not used as evidence for numerical claims.
- U.S. Bureau of Reclamation — Colorado River Accounting and Water Use Report, Calendar Year 2025
- U.S. Bureau of Reclamation — acre-foot conversion fact sheet
- U.S. Bureau of Reclamation — Colorado River Post-2026 Operations
- Las Vegas Valley Water District — Annual Comprehensive Financial Report, fiscal years ended June 30, 2025 and 2024
- Las Vegas Valley Water District — Where Your Water Comes From
- Las Vegas Valley Water District — Excessive Use Charge FAQs
- Southern Nevada Water Authority — 2026 Water Resource Plan, Chapter 2
- Southern Nevada Water Authority — 2026 Water Resource Plan, Chapter 3
- Southern Nevada Water Authority — 2024–2029 Joint Water Conservation Plan
- Southern Nevada Water Authority — Operating and Capital Budget, fiscal year ending June 30, 2026
- Southern Nevada Water Authority — What We're Doing to Conserve
- Southern Nevada Water Authority — Flowing Forward
- Southern Nevada Water Authority — Water Shortages
- Southern Nevada Water Authority — Where Your Water Comes From
- Southern Nevada Water Authority — Xeriscape Conversion Study
- Southern Nevada Water Authority — Understand Laws and Ordinances
How to cite
Las Vegas Xeriscape. “Las Vegas Water Usage Statistics.” Las Vegas Xeriscape Research, v1.0. Published and last verified . https://lasvegasxeriscape.com/research/las-vegas-water-usage-statistics/
Research section
Las Vegas Xeriscape Research publishes primary-source data on Southern Nevada water use and xeriscape conservation. No commercial content, lead forms or affiliate links appear on research pages.